Introduction
As the majority of biopharmaceuticals are produced in aerobic processes, the correct oxygen supply of the cells is crucial and a common challenge in both cell culture and microbial applications. When bioreactors are aerated, oxygen is transferred from the gas phase to the liquid phase (i.e., oxygen molecules enter a dissolved state). Once dissolved, the oxygen can be taken up and utilized by cells. It is important to ensure that the rate at which oxygen is transferred from the gas phase to the liquid phase (the oxygen transfer rate (OTR)), exceeds the rate at which oxygen is consumed by the cells (the oxygen uptake rate (OUR)). If the oxygen supply is limited or the oxygen concentrations fluctuate, the growth rate of the cells can be reduced, which may lead to changes in cell metabolism and eventually a lower product formation rate (Seidel et al. 2021). The OTR in a bioreactor system can be described by the following equation:

Where:
OTR = oxygen transfer rate (mol/(m3 ∙ h))
kL = gas transfer coefficient (m/h)
a = gas-liquid interface surface area per liquid volume (m2/m3)
CO2 (l)* = concentration (C) of oxygen (O2) in the liquid (l) (mol/m3)
CO2 (l) = actual oxygen concentration in the liquid (DO) (mol/m3)
CO2(l)* – CO2(l) = concentration gradient or driving force (mol/m3)
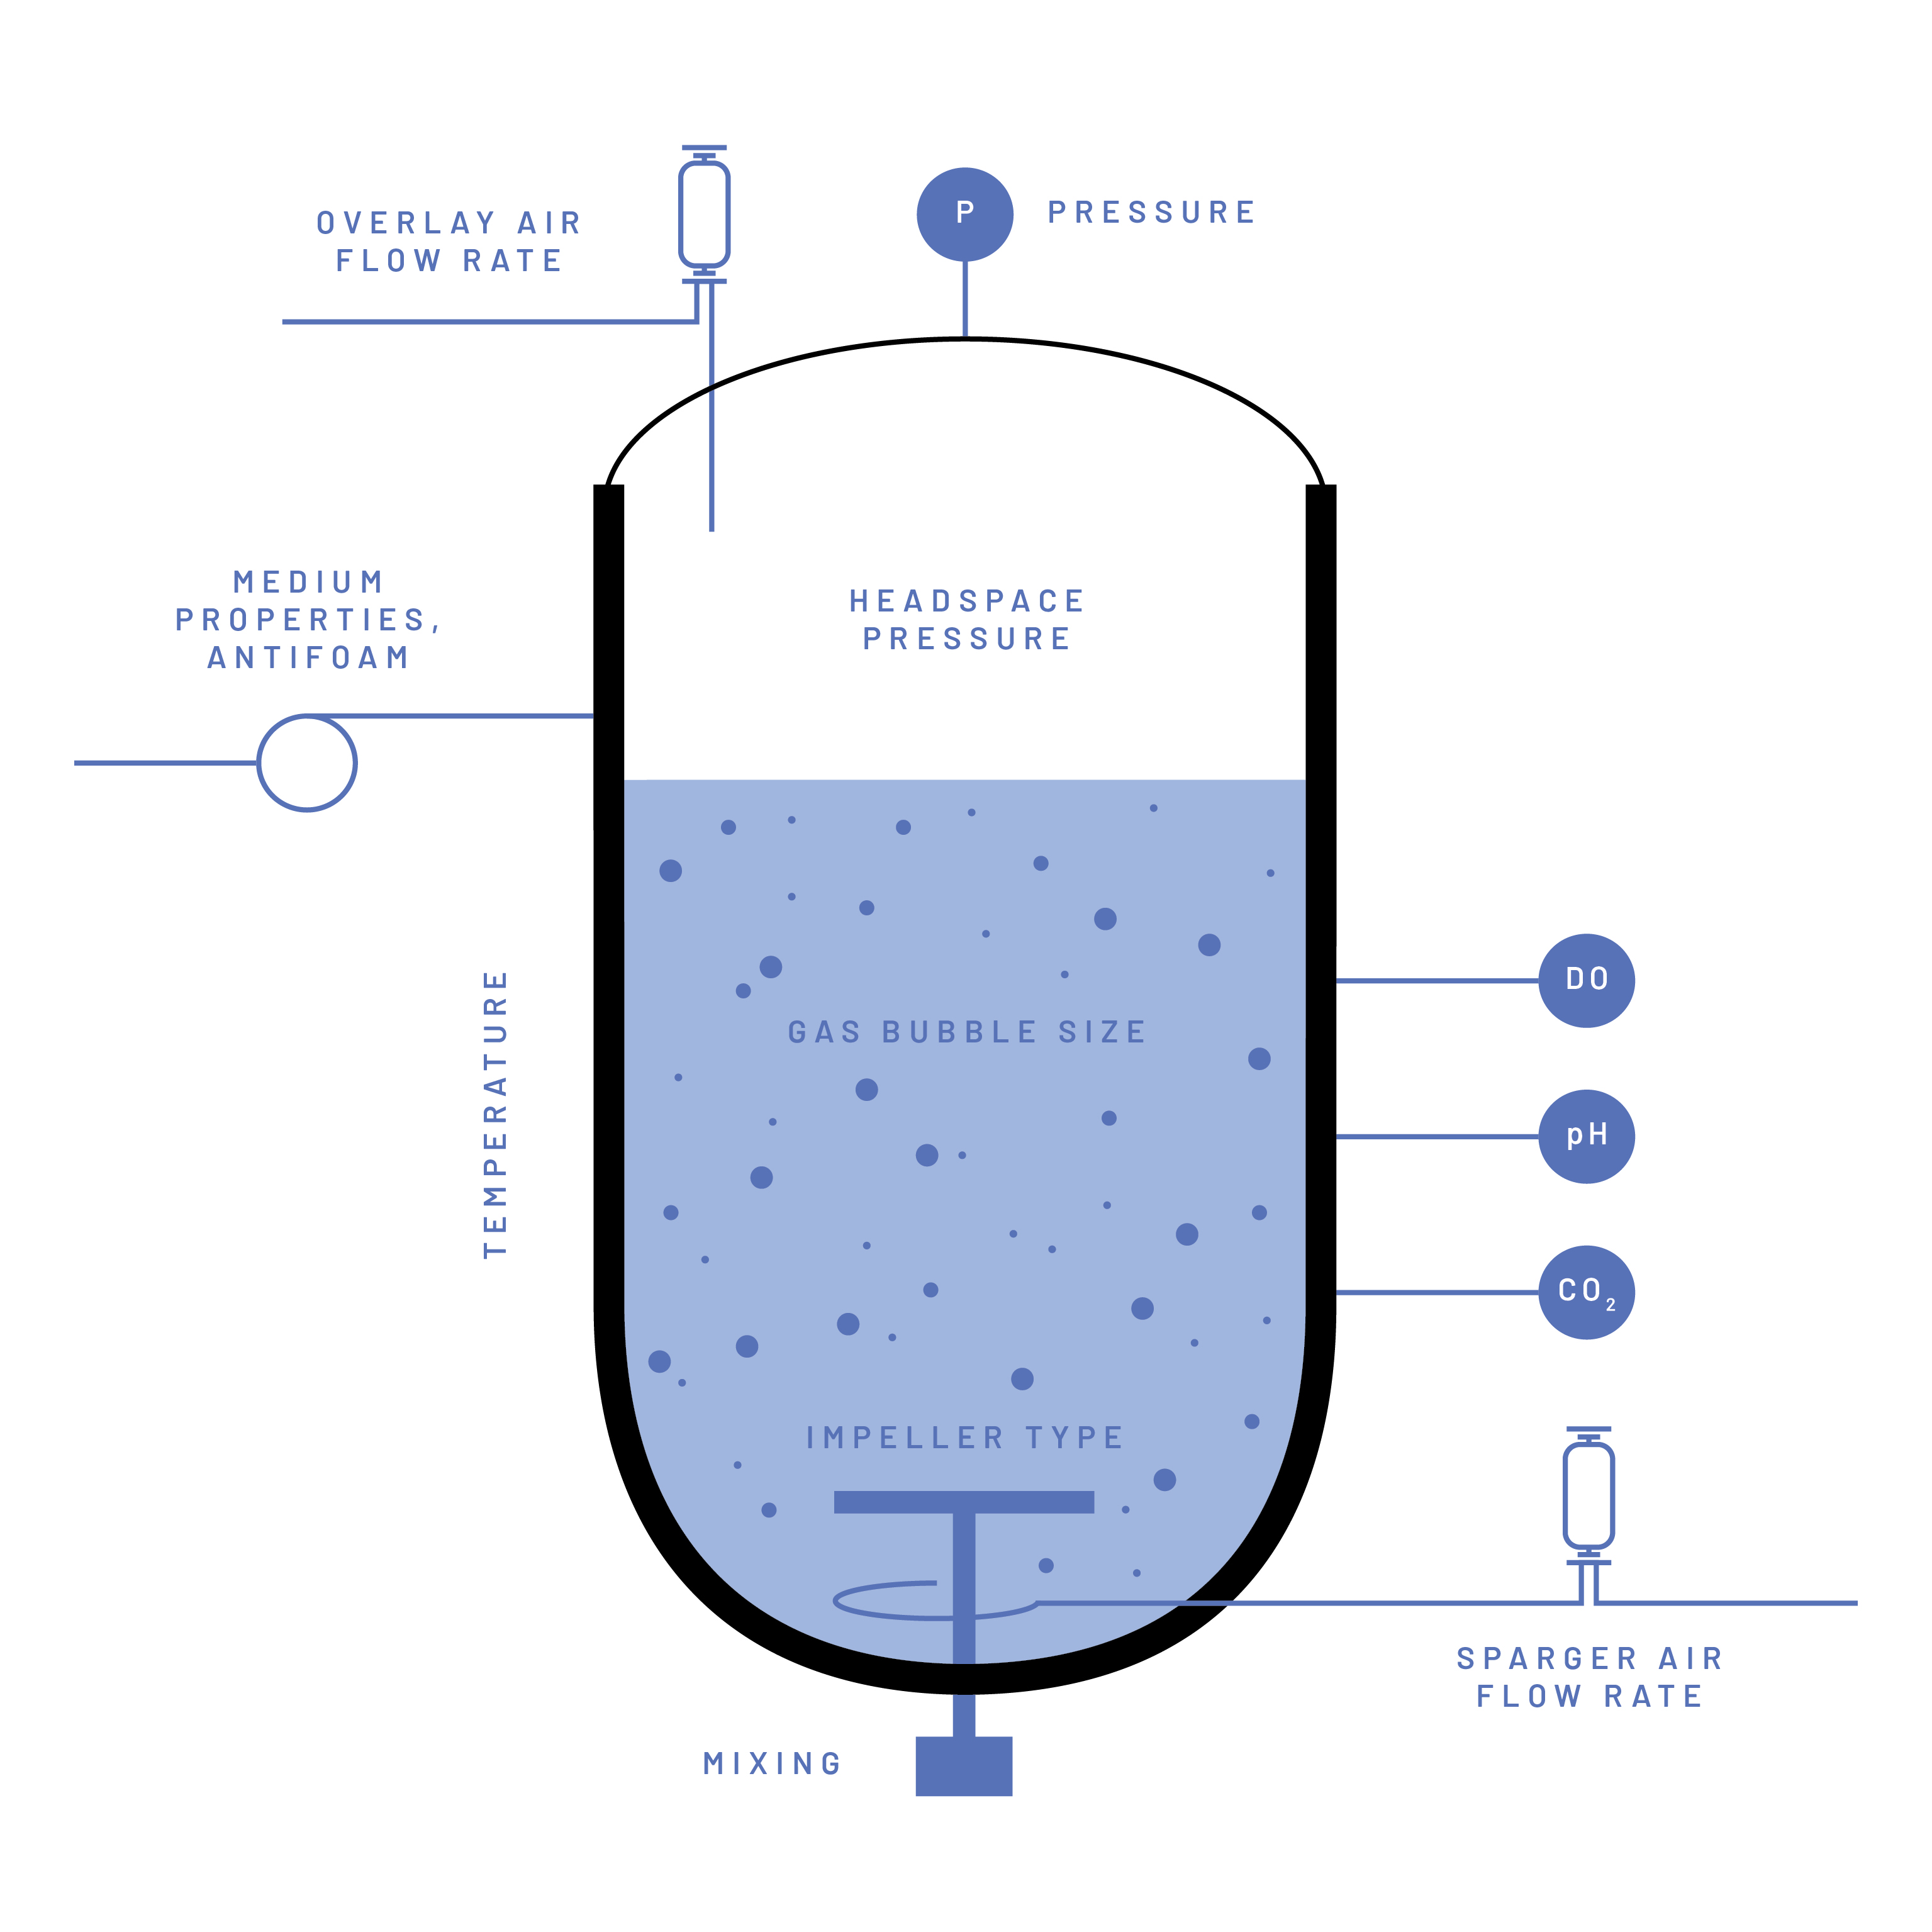
The OTR is influenced by a great variety of factors such as the dimensions and configuration of the bioreactor vessel and certain auxiliaries (e.g., reactor volume, reactor geometry, impeller type and diameter, sparger type), the configuration and settings of the equipment used to enhance gas transfer (e.g., stirrer speed, air flow), the physical environment in the bioreactor system (e.g., temperature, pressure), the presence or absence of certain compounds in the cultivation medium (e.g., proteins, surfactants, salts) or the cells in the cultivation medium (e.g., cell density, cell morphology) (Figure 1) (Garcia-Ochoa and Gomez 2009).
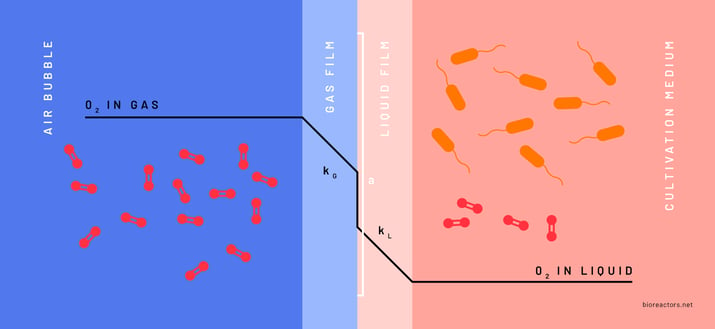
Since numerous factors influence the OTR, it is a common practice in biotechnology to assess the oxygen transfer efficiency specific to the bioreactor system and process conditions. This evaluation typically involves experimentally determining the kLa parameter, a comprehensive parameter combining the ‘kL’ and the ‘a’ parameters from the OTR equation. The ‘kL’ represents the rate of molecular diffusion through the gas-liquid interface and the ‘a’ represents the area of this interface per liquid volume (Figure 2). The kLa is expressed in reciprocal time units (h-1). The kLa value indicates the gas transfer capacity within the system, defining the limits of any given bioprocess (OTRmax). This information helps to determine if a bioprocess is oxygen-limited by design, which can be instrumental when optimizing and upscaling any aerobic bioprocess.
Different methods exist to experimentally determine the kLa value e.g., the sulfite oxidation method, static gassing-out method, dynamic (gassing-out) method, and the oxygen-balance method (Vanags and Suleiko 2022). In the literature, these methods are not always named consistently. In this article, we adopt the terminology from Vanags and Suleiko (2022) and the method described here is based on the static-gassing out method.
Static gassing-out method:
The static gassing-out method was first described by Wise (1951) and is today widely used to characterize oxygen transfer in different bioreactor systems. With the static gassing-out method the dissolved oxygen concentration is measured in the medium with an oxygen sensor. The bioreactor is filled with any liquid medium. The oxygen concentration of the medium is set to zero by degassing with nitrogen. Afterward, aeration is performed under process conditions (at a defined aeration rate and stirrer speed). By monitoring the dissolved oxygen concentration over time, the rate at which the gas is transferred from the gas phase to the liquid phase can be quantified and the kLa can be determined (Wise 1951).
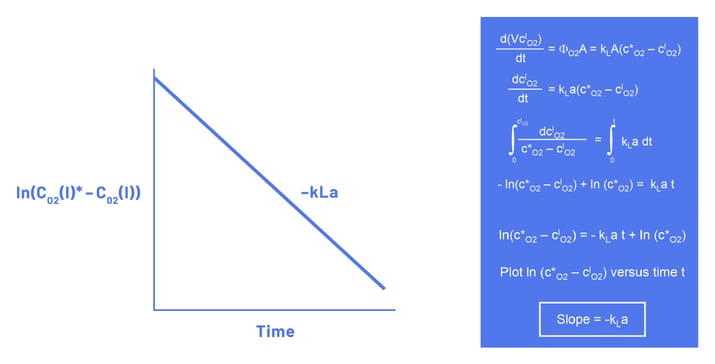
The static gassing-out method assumes that the equilibrium concentration of dissolved oxygen CO2(l)* is constant during the oxygenation of the medium. The slope of the resulting curve then equals -kLa (Figure 3).
As the static gassing-out method assumes that the liquid phase is in complete equilibrium with the gas phase (CO2(l)* = constant), this method is more accurate for small-scale bioreactors than for large-scale bioreactors. In large-scale bioreactors, it becomes more difficult to reach an equilibrium due to the relatively larger liquid volume and the smaller surface area-to-volume ratio. Although correction factors have been derived to compensate for this phenomenon, Van‘t Riet and Tramper (1991) concluded that the static gassing-out method. should not be used for vessels over 1 meter high (Van’t Riet and Tramper 1991).
Determining the kLa parameter experimentally is a laborious process that involves the following tasks:
-
Preparing the bioreactor system: This step demands physical preparation of the bioreactor system, often requiring autoclaving when working with nutrient-rich mediums to ensure sterility.
-
Performing the experiment: This phase requires configuring the bioreactor controller with the correct parameters. Additionally, this step involves activating data logging for essential process parameters in SCADA software, constant monitoring of the run(s), and exporting the accumulated data for subsequent analysis.
-
Data processing: After the experiment, manual data processing is necessary. This involves utilizing software such as Excel to perform calculations and derive the necessary kLa value(s) from the raw data.
The kLa determination application described here drastically reduces the time and effort that needs to be invested to evaluate the kLa values by fully automating steps (2) and (3) described above.
Materials and Methods
A dedicated process control operation was written in Lucullus® to automate the kLa determination. The operation is compatible with Lucullus® versions 3.10.5 and higher. The operation contains an algorithm in the form of a step chain and two complementary scripts. The step chain consists of more than 60 individual steps, which are interlinked to enable the proper execution of the kLa determination experiment (Figure 4).
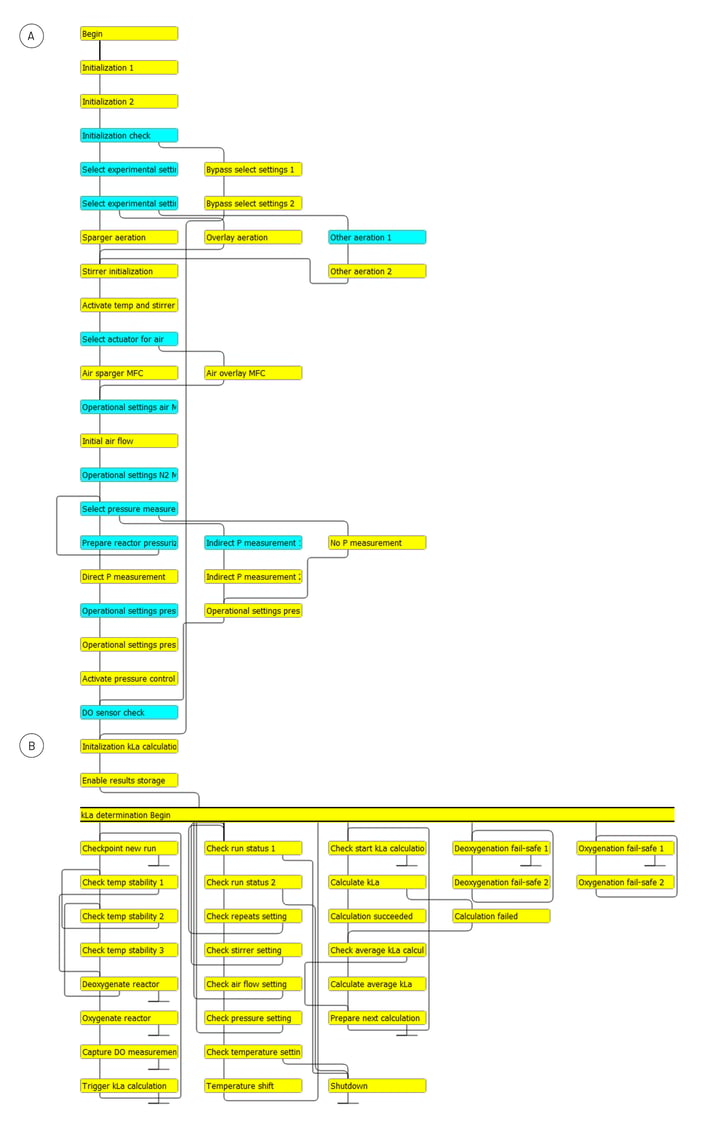
Functionally, the step chain can be divided into two distinct parts:
-
The first part of the step chain focuses on initializing the experiment for the kLa determination. It contains several distinct steps delineated by blue headers, linked to a Lucullus® pop-up window. The pop-up windows enable users to manually provide the requested information. Navigating through this first section of the step chain can be accomplished within 10 minutes.
-
The second part of the step chain is fully automated and executes the actual kLa determination experiment. Depending on the experimental settings selected by the user, and the specific type and size of the bioreactor, this operation runs over hours or even days. This part of the step chain includes the following functions: Ensuring temperature stability, deoxygenating the reactor with N2 gas, oxygenating the reactor with air, collecting data from the DO sensor, progressing through the experimental settings, and calculating the (average) kLa values.
The data presented here was collected using two my-Control controllers (Getinge Applikon) and two 500 mL miniBio bioreactors (“Green” and “Blue”) (Getinge Applikon) at the Wageningen University & Research (WUR) in Wageningen, the Netherlands. Both bioreactors were equipped with a single marine impeller (vortex, 28 mm diameter) and a L-shaped sparger. The reactors were filled with 300 mL water and heated to 20 °C before the start of the experiments. N2 gas and air were supplied using Mass Flow Controllers (MFCs) built into the my-Control controllers. The dissolved oxygen was measured by a LumiSens DO sensor (Getinge Applikon).
To demonstrate the capabilities of the kLa determination operation, four different experiments were carried out:
-
Air flow and stirrer speed variation. This experiment was executed with a total of 10 different settings for air flow, starting at 25 mL/min and incrementing with steps of 25 mL/min to 250 mL/min. Similarly, 10 different settings for the stirrer speed were tested, starting at 100 rpm
and incrementing with steps of 100 rpm to 1000 rpm. In total, 100 unique combinations of air flow and stirrer speed were tested. Each unique combination of settings was repeated 3 times, resulting in a total of 300 executed runs per reactor. -
Reactor-to-reactor variation. This experiment was executed with two miniBio bioreactors with a completely identical hardware layout. For air flow, 3 different settings were tested: 50 mL/min, 100 mL/min, and 150 mL/min. For stirrer speed, 3 different settings were tested: 250 rpm, 500 rpm, and 750 rpm. In total, 9 unique combinations of air flow and stirrer speed were tested. Each unique combination of settings was repeated 3 times, resulting in a total of 27 executed runs per reactor.
-
Temperature variation. This experiment was executed with two temperature settings: 20 °C and 37 °C. For air flow, 3 different settings were tested: 50 mL/min, 100 mL/min, and 150 mL/min. For stirrer speed, 3 different settings were tested: 250 rpm, 500 rpm and 750 rpm. In total, 9 unique combinations of air flow and stirrer speed were tested. Each unique combination of settings was repeated 3 times at 20 °C and 37 °C, resulting in a total of 54 executed runs per reactor.
-
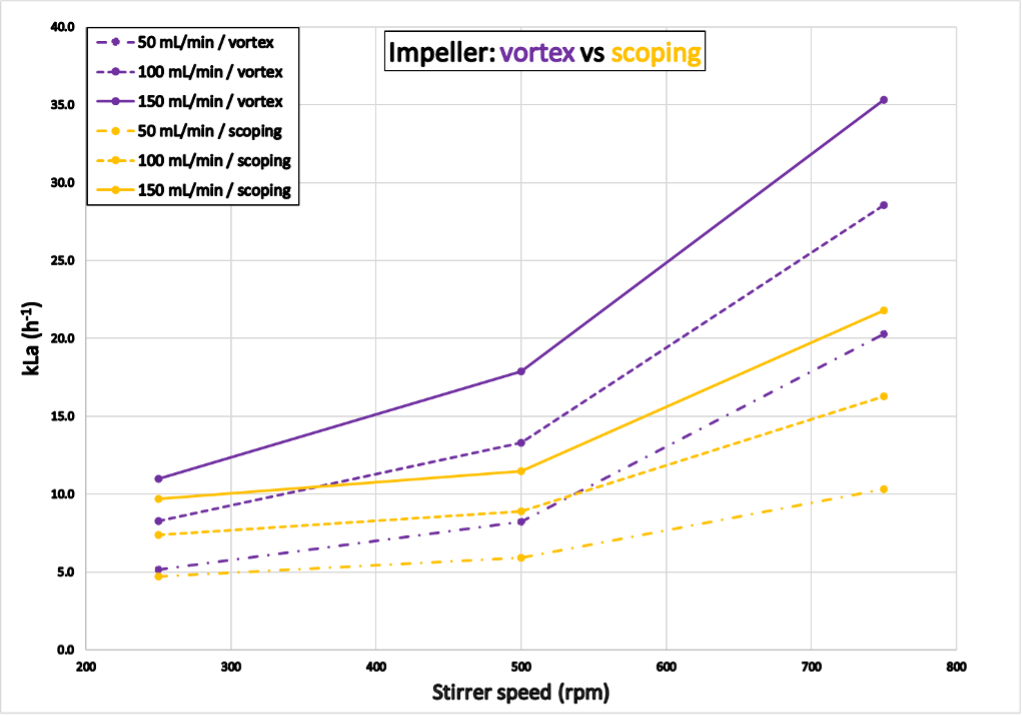
Impeller configuration variation. This experiment was executed with two different stirrer rotation directions, using the same marine impeller: clockwise and counter-clockwise (applying the marine impeller as a vortex or scoping impeller, respectively). For air flow, 3 different settings were tested: 50 mL/min, 100 mL/min, and 150 mL/min. For stirrer speed, 3 different settings were tested: 250 rpm, 500 rpm, and 750 rpm. In total, 9 unique combinations of air flow and stirrer speed were tested. Each unique combination of settings was repeated 3 times using the same marine impeller clockwise and counterclockwise, resulting in a total of 54 executed runs per reactor.
After configuring the experimental settings in Lucullus®, the experiments were set to run autonomously, i.e., without supervision. Upon completion, Lucullus® automatically terminated the kLa operation. The experimental data was then exported to Excel (Figure 5-8).
Results and Discussion
The four experiments to test (1) air flow and stirrer speed variation, (2) reactor-to-reactor variations, (3) temperature variations and (4) impeller configuration variation were completed at the WUR. For all four experimental setups, the kLa calculation success rate was at 100%. For each unique condition (repeated 3 times), the average kLa with the corresponding standard deviation was calculated. The variation of the kLa values between repeats of the same condition was small, particularly at lower air flow rates and stirrer speeds with standard deviation values of 0.01 h-1. (Table 2, Appendix).
Experiment 1 (air flow & stirrer speed variation)
Experiment 1 was completed within 114 hours for reactor “Blue” and 90 hours for reactor “Green”. The results shown in Figure 5 correspond to kLa values determined with reactor “Green”. As expected, the kLa increases with increasing air flow and stirrer speed. The results for reactor “Blue” are shown in the appendix.
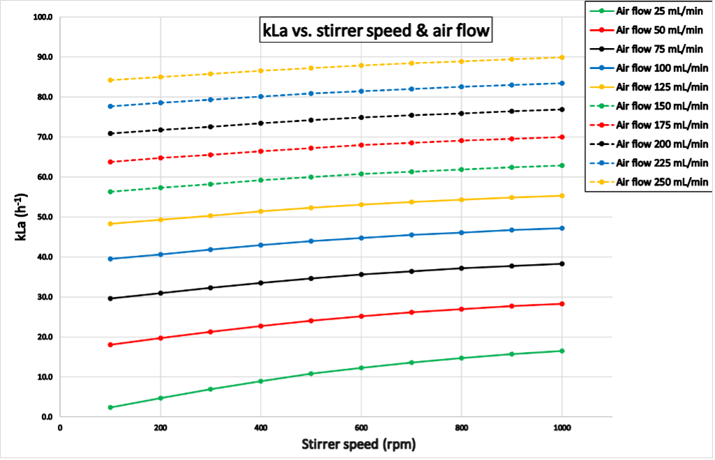 Figure 5: Results from experiment 1 for reactor “Green”: kLa as a function of different stirrer speeds and air flow rates. The kLa increases with higher stirrer speeds and airflow rates.
Experiment 2 (reactor-reactor variation)
The results shown in Figure 6 correspond to kLa values determined with reactor “Blue” and “Green”. Experiment 2 was completed within 7.3 hours for reactor “Blue” and 6.3 hours for reactor “Green”, respectively. Despite an identical hardware layout and experimental setup , the kLa values determined were higher for the reactor “Green” than for “Blue”. This difference in performance was consistent and observed during all the other experiments presented here. Although both reactors had an identical hardware layout, subtle and/or unnoticed differences must have existed e.g., the sparger pipe of the reactor “Blue” may have suffered from clogging due to previous usage.
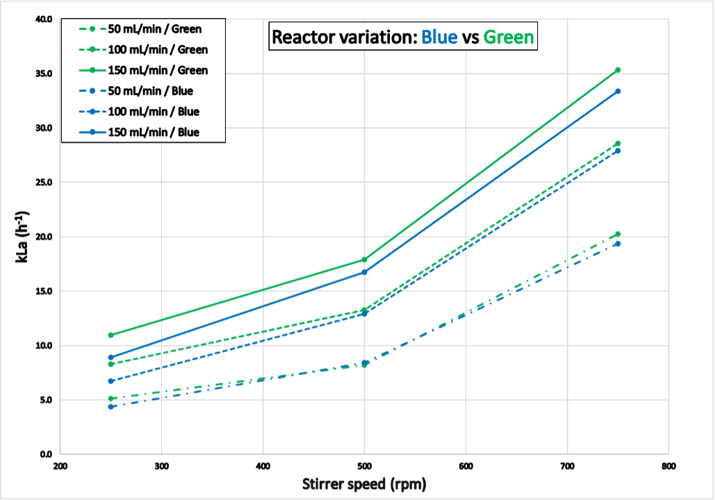 Figure 6: Results from experiment 2 for reactor “Blue” and “Green”: Reactor to reactor variation. The kLa values at similar process conditions are higher for the reactor “Green” than for “Blue”.
Experiment 3 (temperature variation)
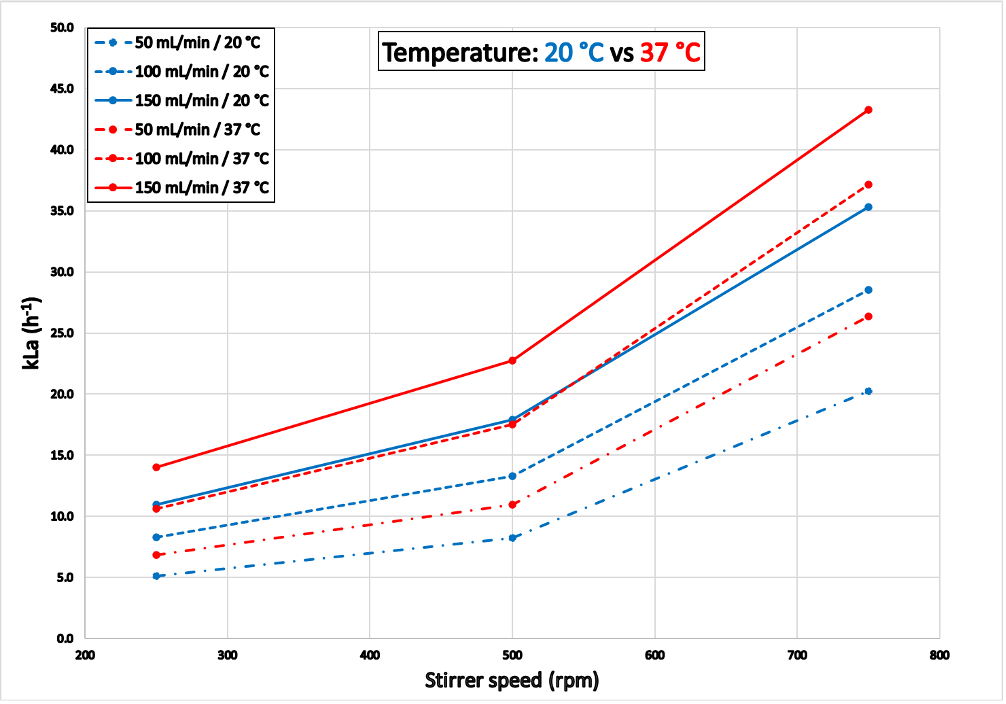
The results shown in Figure 7 correspond to kLa values determined with reactor “Green”. Experiment 3 was completed within 6.3 hours (at 20°C) and 5.6 hours (at 37°C). At 37°C the gas transfer was more effective than at 20°C with considerably higher kLa values. The results for reactor “Blue“ are shown in the appendix.
Experiment 4 (impeller configuration variation)
The results shown in Figure 8 correspond to kLa values determined with reactor “Green”. Experiment 4 was completed within 6.3 hours (vortex impeller) and 10.3 hours (scoping impeller). The gas transfer was more effective with a vortex impeller configuration than with a scoping impeller configuration, resulting in considerably higher kLa values for the former. The results for reactor “Blue” are shown in the appendix.
Conclusion
The results demonstrate the transformative potential of the automated kLa determination application. The main advantages are a significantly reduced time investment, improved reproducibility, and enhanced process understanding.
The overall time to determine the kLa by the operator is significantly reduced. To put this into perspective: The Lucullus® application to determine the kLa could save an operator a remarkable 30 - 90 man-hours for executing experiment 1 (reactor “Green”) compared to the manual execution of the same experiment. Taking into account the time required for manual processing of the data and subsequent calculation of the kLa values for the 300 runs, even more time could be saved. A comparison of the time expenditure between automated and manual kLa determination based on experiment 1 (300 runs, reactor “Green”) is shown in Table 1. Even when the manual execution of the experiment and manual processing of the raw data have been optimized, a time reduction of approximately 35 hours could be achieved by employing the automated kLa determination application, which corresponds to a 96% effort reduction.
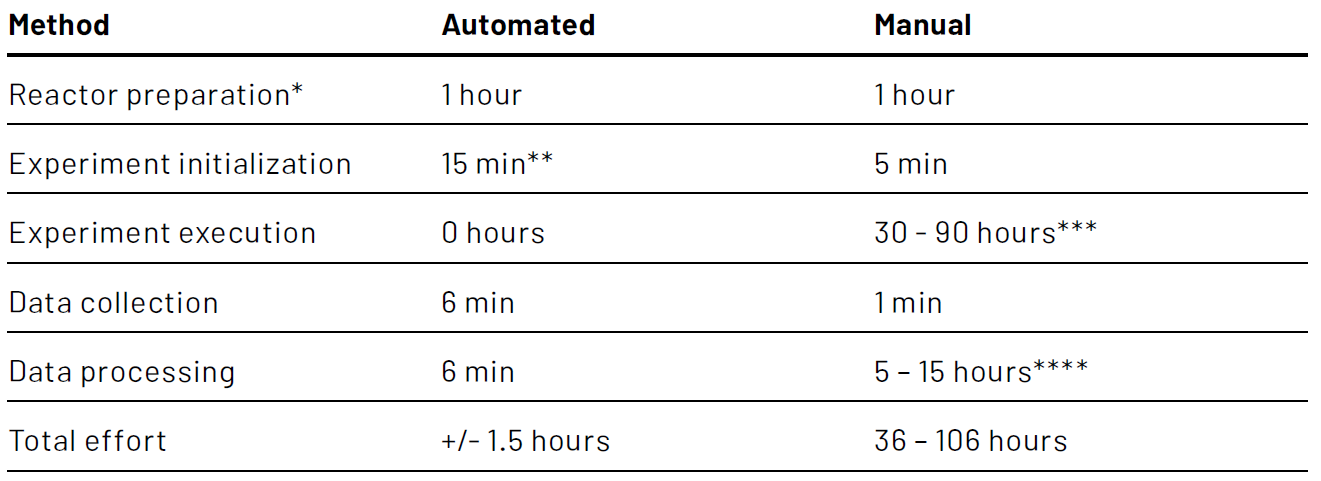
** Includes starting up the bioreactor controller, initializing the Lucullus® software, starting a process in Lucullus®, and entering values for all experimental settings in Lucullus®
*** The average time of a single kLa determination run for experiment 1 was approximately 18 minutes. In the most optimistic scenario, the operator uses an alarming system to spend most of the run time on other tasks. In the most pessimistic scenario, the operator monitors the runs continuously to ensure a completed run is stopped in a timely fashion and a new one is started
**** In the most optimistic scenario, the operator has a software template available to automatically process the raw data and calculate kLa values. In the most pessimistic scenario, the operator has no such template available and manually processes the data
The automated kLa determination application significantly enhances reproducibility by eliminating manual interventions. In addition, generating large data sets enhances the statistical relevance of the generated results, providing more robust and reliable kLa values.
The reactor-reactor variation exposed with experiment 2 demonstrates the necessity to determine the kLa values for each bioreactor system individually. It is not correct to assume that reactors have the same gas transfer capabilities, even with a completely identical hardware configuration. Operators could use that learning to adjust their workflows by determining the kLa values overnight and use the results available the next morning to take into account differences in gas transfer efficiency of the individual bioreactors to adjust the aeration strategy.
The results of all four executed experiments show the potential of attaining a much better understanding of all the different factors that can influence the gas transfer characteristics in a bioreactor system. In the future, it would be interesting to determine the kLa value with other methods for kLa determination and investigate whether a clear relation can be established between experimentally determined kLa values and models for calculating kLa values.
Key Points
The automated kLa determination Lucullus® application is a powerful new tool for determining kLa values of bioreactor systems, saving users a significant amount of time and effort, increasing reproducibility, and generating large datasets with statistical significance. This application demonstrates the capability of Lucullus® for successfully automating the execution of various types of bioprocesses.
References
- Garcia-Ochoa, Felix, and Emilio Gomez. 2009. “Bioreactor Scale-up and Oxygen Transfer Rate in Microbial Processes: An Overview.” Biotechnology Advances 27(2):153–76. doi: https://doi.org/10.1016/j.biotechadv.2008.10.006.
- Seidel, Stefan, Rüdiger W. Maschke, Sören Werner, Valentin Jossen, and Dieter Eibl. 2021. “Oxygen Mass Transfer in Biopharmaceutical Processes: Numerical and Experimental Approaches.” Chemie Ingenieur Technik 93(1–2):42–61.
doi: https://doi.org/10.1002/cite.202000179. - Vanags, J., and A. Suleiko. 2022. “Oxygen Mass Transfer Coefficient Application in Characterisation of Bioreactors and Fermentation Processes.” Latvian Journal of Physics and Technical Sciences 59(5):21–32.
doi: https://doi.org/10.2478/lpts-2022-0038. - van’t Riet, Klaas, and Johannes Tramper. 1991. Basic Bioreactor Design. CRC Press.
- Wise, W. S. 1951. “The Measurement of the Aeration of Culture Media.” Journal of General Microbiology 5(1):167–77. doi: https://doi.org/10.1099/00221287-5-1-167.
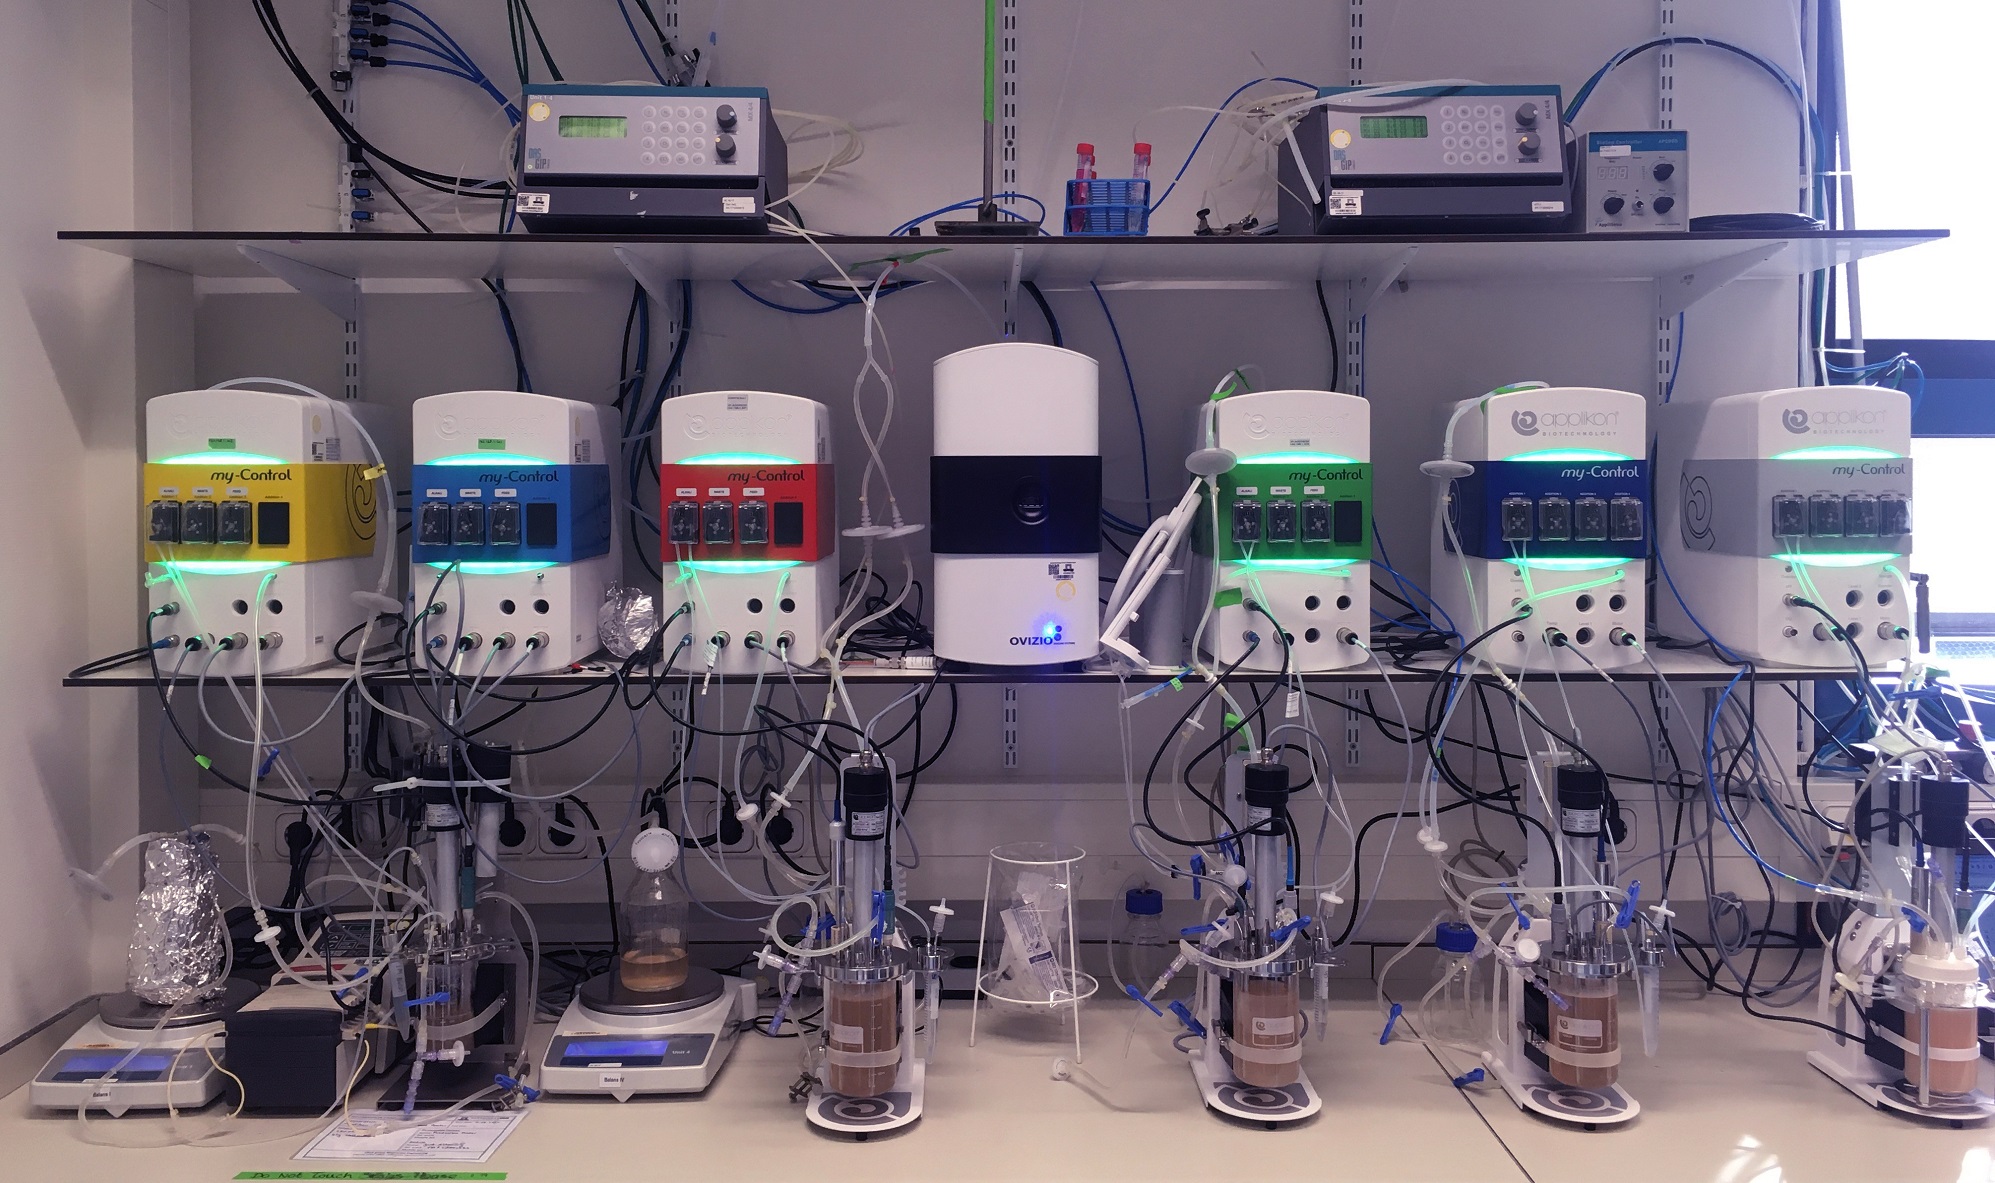
- Header picture has been taken by Jort Altenburg, at Animal Cell Lab, Department of Bioprocess Engineering, Wageningen University & Research
Additional results of experiments 1 – 4 are presented in Appendix which is available in the PDF version of this article. It can be downloaded here.