Securecell AG/Vetsuisse-Fakultät ZH, MSRU/CABMM, May 2022
Keywords: Seraccess, automated blood sampling, animal model
Background
Automated blood glucose monitoring with Securecell’s SeraMaster proto-type was tested in a clinical setting as part of a feasibility study (see Milestone 6).
Several experiments on live sheep were defined to test automated blood sampling in vivo. In a first series of experiments, the automated sampling process, including dilution with NaCl, was compared with manual sampling.
Study Design
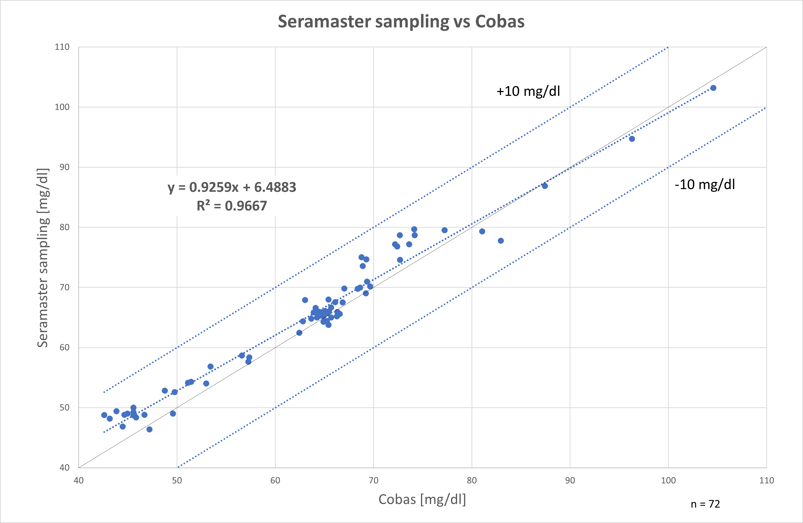
To evaluate the automated method, the bias (=mean deviation from the reference method) was calculated. For samples from the central vein the bias was 1.9 mg/dl (n=32) and for samples from the peripheral artery it was 1.7 mg/dl (n=40). All 72 data points (100%) are within the margin of error of ± 6.5 mg/dl.
The following figure shows the regression analysis between SeraMaster glucose values (y-axis) and manual sampling (x-axis). The correlation coefficient (R2) is 0.9667, which means that the two methods are equivalent and therefore interchangeable.
Results
To evaluate the automated method, the bias (=mean deviation from the reference method) was calculated. For samples from the central vein the bias was 1.8 mg/dl (n=96) and for samples from the peripheral artery it was 0.8 mg/dl (n=104). All 200 data points (100%) are within the margin of error of ± 10.0 mg/dl.
The following figure shows the regression analysis between SeraMaster glucose values (y-axis) and manual sampling (x-axis). The correlation coefficient (R2) is 0.9930, which means that the two methods are equivalent and therefore interchangeable.
The regression analysis between SeraMaster glucose values (y-axis) and manual sampling (x-axis)
The following images illustrate the experimental setup in the stables of the university. At the end of the day, the laboratory animals were allowed to return to the pasture.
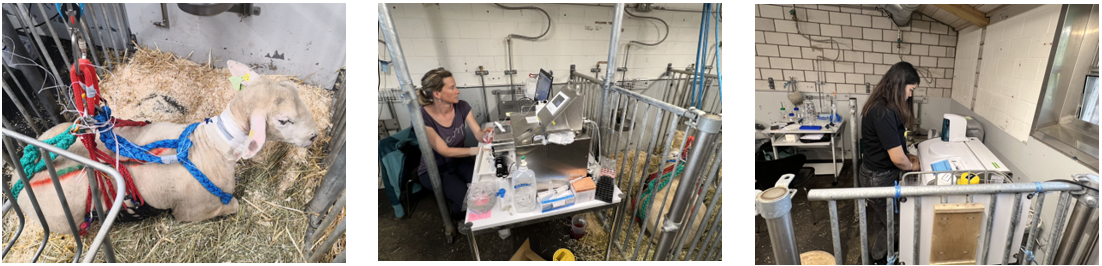 The experimental setup in the stables of the university
Next steps
In the next series of experiments on sheep, automated blood sampling will be combined with automated glucose measurement.
| Continuous automated blood sampling with the SeraMaster prototype is equivalent to the manual refer-ence method. The bias, a measure of the accuracy of the method, is 1.9 mg/dl (venous) and 1.7 mg/dl (arterial) compared to the reference method. The regression analysis shows that the two methods are interchangeable. Therefore, it makes sense to tackle the next series of experiments |